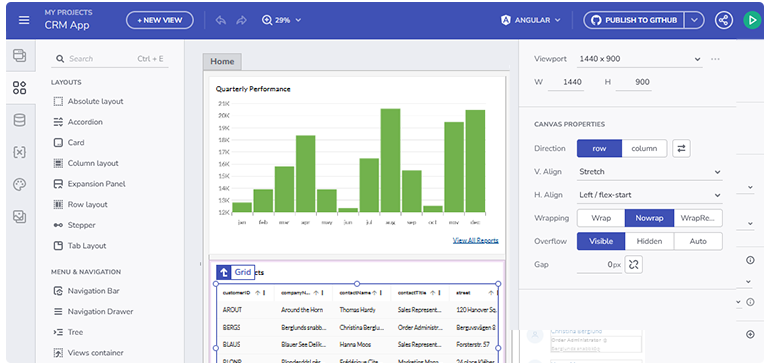
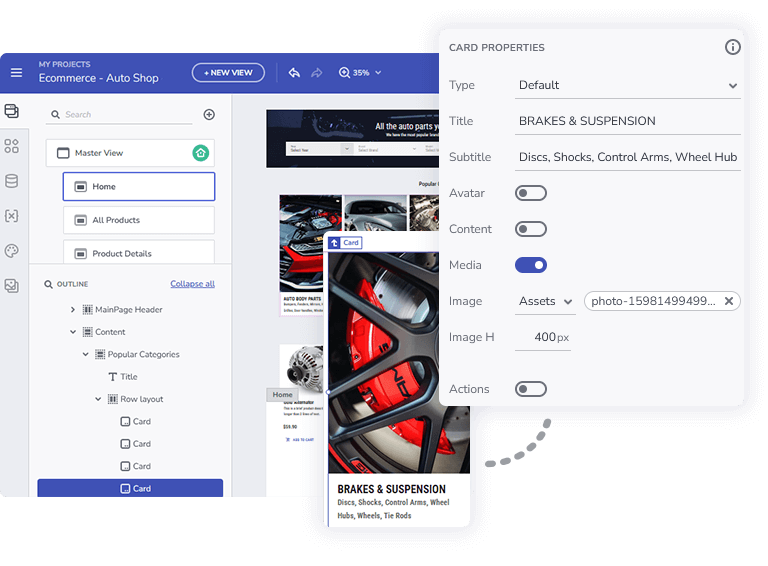
WYSIWYG App Development Platform
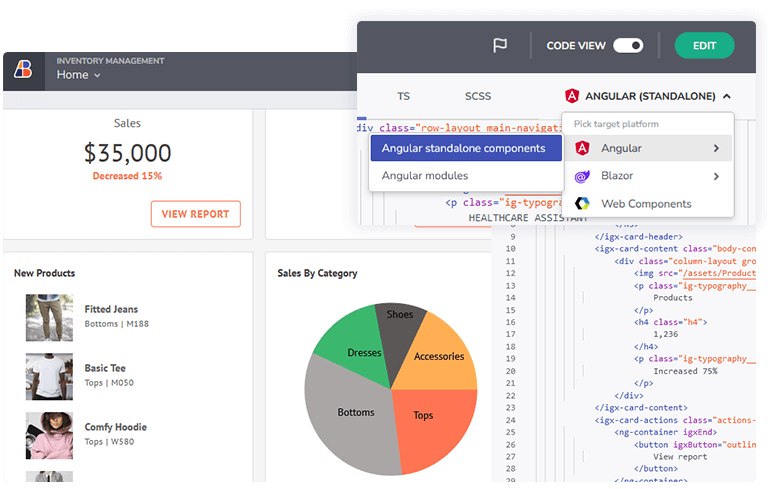
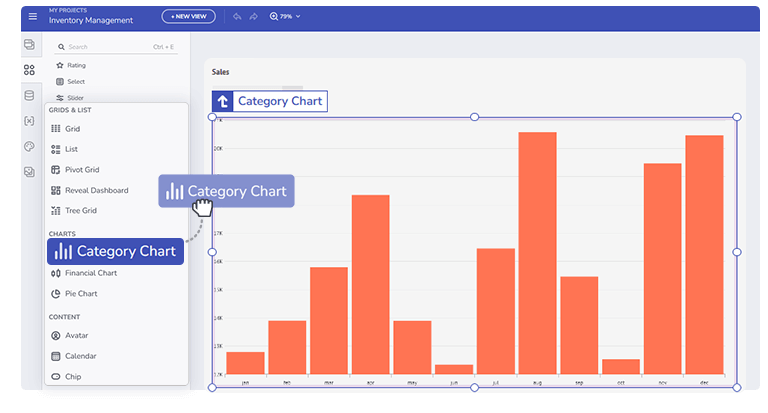
- Visually build apps with 65+ drag-and-drop UI components, then generate production-ready code for Angular, Blazor, React or Web Components
- Shorten development cycles, build apps faster and smarter without sacrificing control or code quality
- Own your code output. Export, modify, and deploy without vendor lock-in

Built by Developers, For Developers
Gartner predicts that by 2026, 75% of new application development will use low-code or no-code technologies.
Great Experiences Lead to Great Results


AI-Powered App Creation
-
Generate full applications from natural language, including multi-page structures, viewports, navigation, themes and more
-
Automate mundane, repetitive tasks and let your team focus on custom functionality, delivering real apps, real fast
-
Get real UI code output for everything you build for Angular, React, Blazor, and Web Components


Rapid,
Cost-Efficient App Development
-
Design apps in a fraction of the time compared to traditional development methods
-
App Builder optimizes the utilization of your team’s resources to deliver high-functioning apps in record time
-
Scale up your applications to meet the growing demands of your organization without major overhauls or disruption
Achieve Unparalleled Team Productivity
-
Digital product teams save up to 80% with low-code accelerators and with our focus on the highest level of code quality output
-
Streamlining your entire app development process from design to code
-
Achieve hyper-productivity while delivering apps


Low-Code WYSIWYG
Drag & Drop Tool
-
With a toolbox of 60+ UI controls
-
Multiple layout options, data binding, routing & navigation, theming & branding, and more
-
Live app preview and full production ready, pixel-perfect code generation in the framework of your choice
Frequently Asked Questions
App Builder is a low-code, WYSIWYG cloud-based tool that eliminates error-prone hand-coding, allowing businesses and developers to prioritize speed, agility, and ease of use in application development. App Builder allows teams to build apps faster compared to traditional coding methods thanks to its visual interface, drag-and-drop functionality, 60+ feature-packed and reusable components, full repository code-generation for Angular, Blazor, React and Web Components.
App Builder can reduce your development time by up to 80%, increase your productivity and effectiveness, lower your costs, improve your return on investment, and enhance the collaboration between developers, designers, and business stakeholders.
Yes, App Builder is a cloud-based low-code tool with a complete WYSIWYG drag & drop app development experience. It eliminates the extensive and error-prone manual coding and reduces the complexity of user interface design and development. This way you can build business apps faster, using a full Toolbox of real UI components, different features, data binding, and more.
With App Builder you are empowered to craft various types of applications for different purposes and sectors. Here are some examples: HR dashboards, content management systems, E-commerce platforms, customer portals, learning portals, CRMs, inventory management apps, and a lot more.
With App Builder, you can easily customize your apps, no matter how you start building them—either from scratch, transforming Sketch/Figma design files to code, or using one of the sample apps. There are visual customizations, component configurations, ability to integrate data from different sources, platform APIs and soon SDK.
Applications built with App Builder can achieve high levels of scalability so you can easily meet any project requirement and respond to the ever-growing customer demands. With the ability to customize components, adjust theming and branding, add data, and more, your apps can scale as your project grows and changes.
App Builder can integrate with external tools and services such as GitHub and Reveal, it offers different deployment options such as on-prem, and soon SDK, and supports data integration with Open API. In addition to this, the low-code tool generates code for different frameworks such as Angular, Blazor, React, and Web Components.
You can always start with a free trial for 14 days or choose one of the subscription plans that best fits your budget and needs. After that, launch the app and then log in. Once you do that, you will be redirected to the App Builder home screen, from where you can start a new app, preview or edit an existing one, drag a Sketch file, or use the Figma UI kit to go from design to HTML.


